
Three figures with their method
TAM, SAM and SOM with the assumption behind each one written down, not implied.
TAM, SAM and SOM are easy to produce and hard to defend. Segmentable derives them from the segment structure of your market — with the arithmetic visible and every input clicking through to its source.
Brief in 10 minutes · assembly in ~2 hours · every number clicks through to its source
TAM, SAM and SOM are three estimates of market size, from largest to smallest: the whole category, the part your product can actually address, and the share you can realistically take in the next few years. Investors ask for them because the three numbers together reveal whether a team understands its market or has just multiplied two figures found online.
That is exactly where most estimates fall apart. A number lifted from a report covers a different geography or a different definition of the category; a top-down guess produces a TAM so large it says nothing; a bottom-up guess uses an average price nobody pays. None of it is dishonest — it is just unverifiable, and the first serious question breaks it.
Segmentable builds the estimate from the structure underneath it. The market is broken into segments, each segment gets a population and an ability to pay derived from collected data, and the three figures follow from that arithmetic. You can open any input, disagree with it, and see what the disagreement does to the result.
TAM, SAM and SOM with the assumption behind each one written down, not implied.
The size comes from segments and their economics, so it can be checked segment by segment.
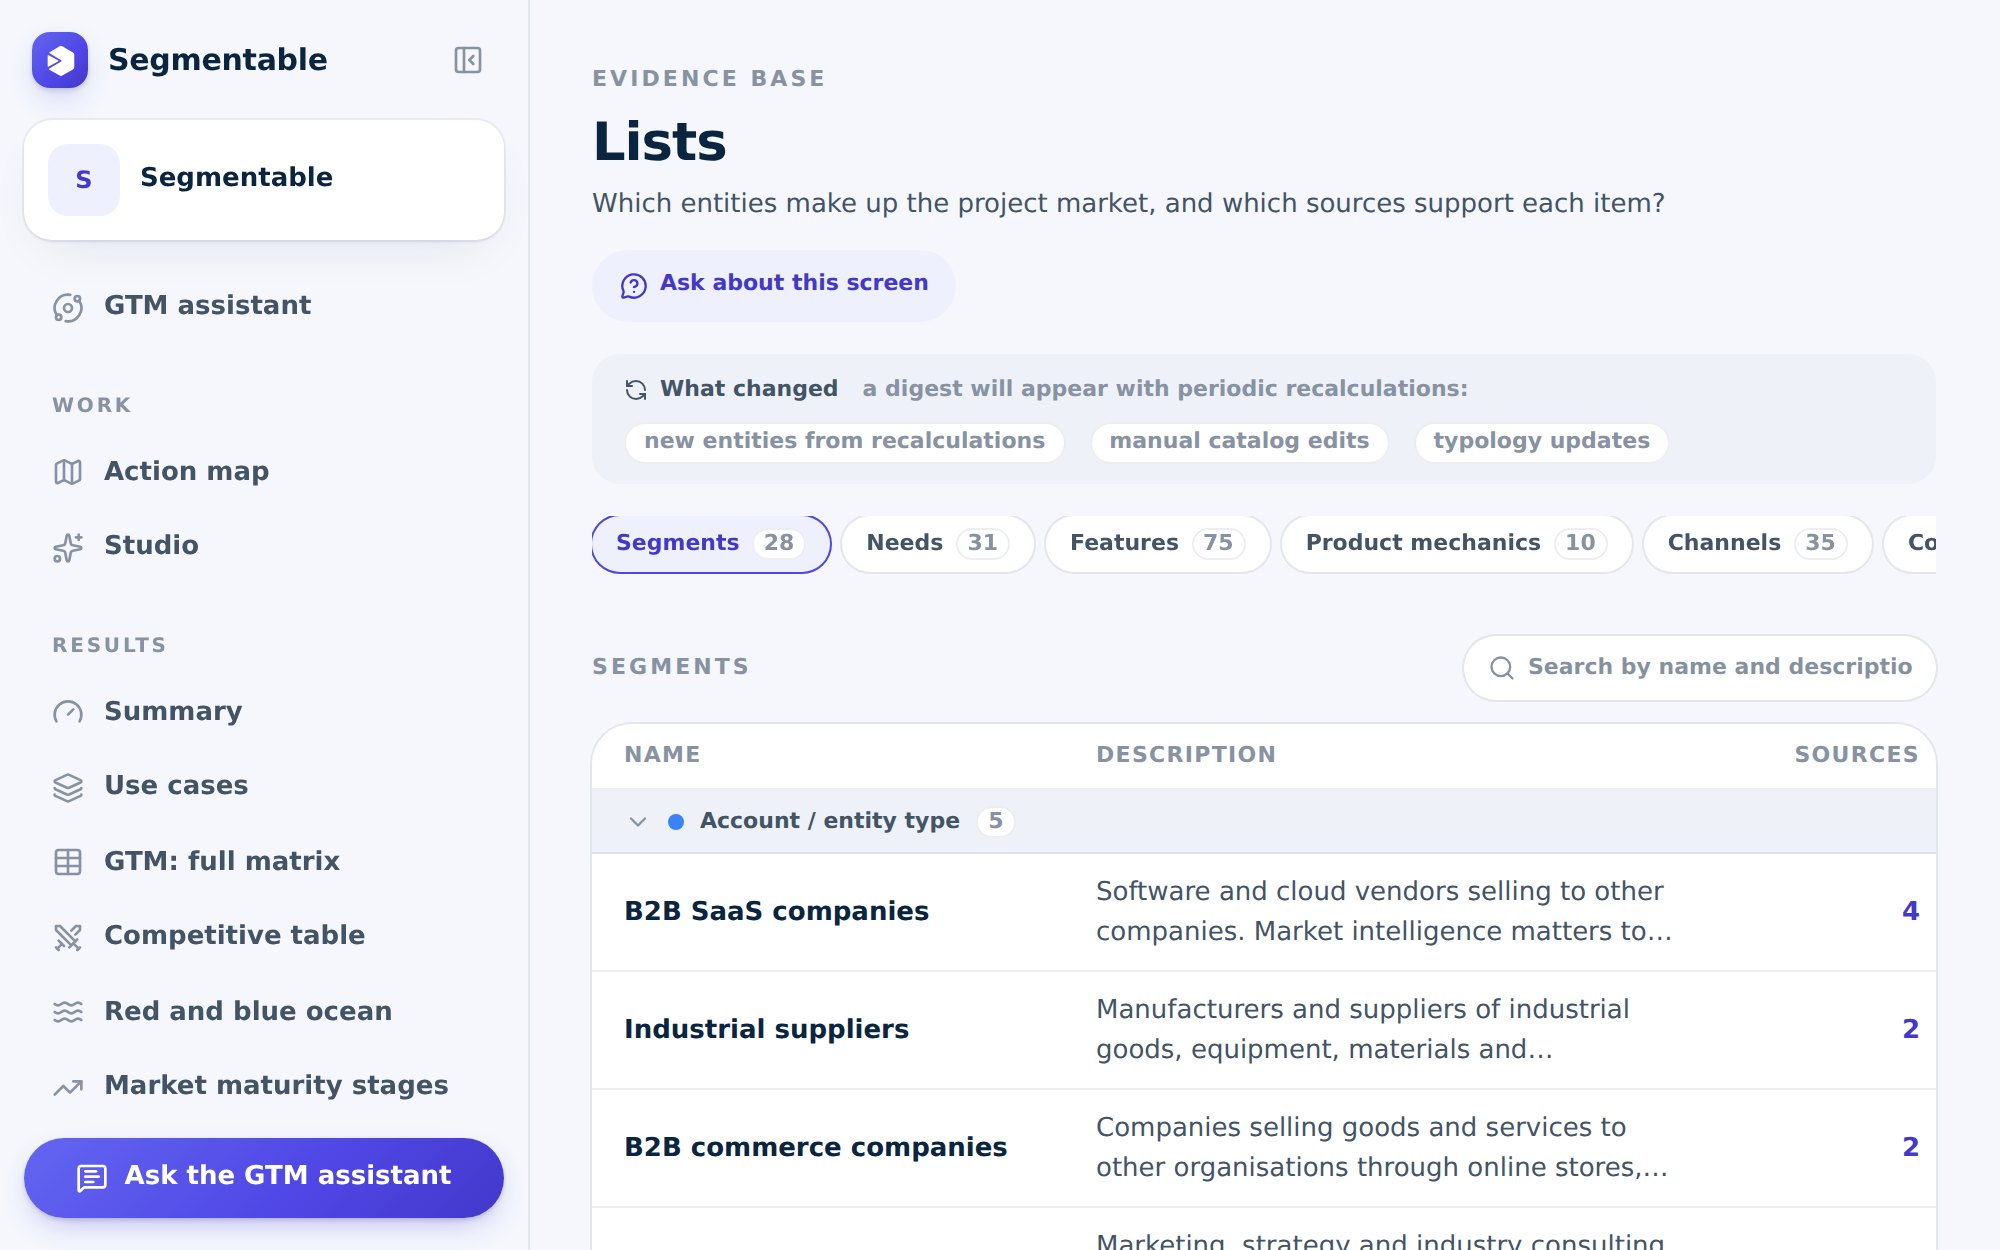
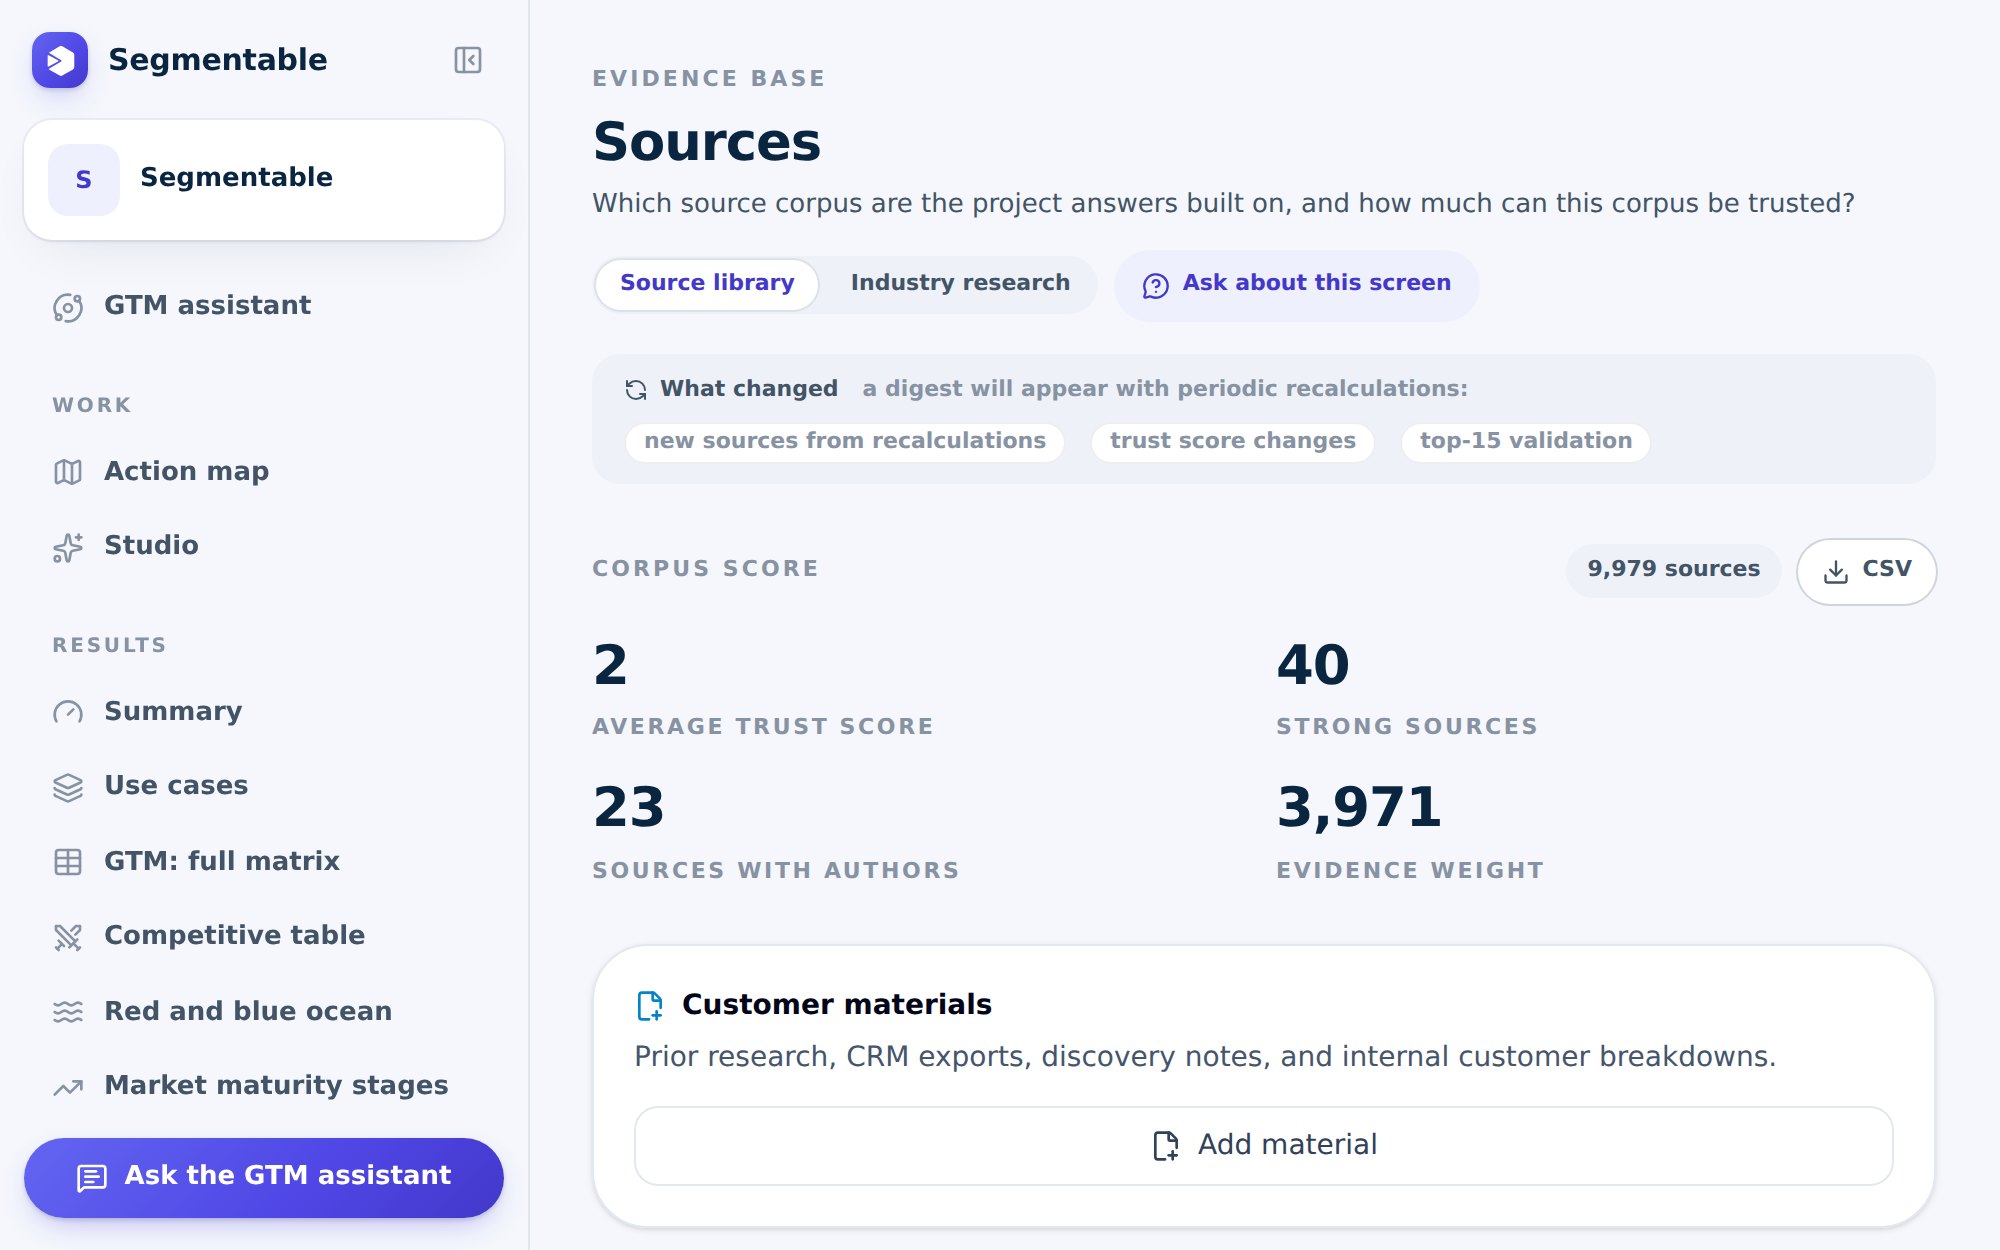
Every population and price input clicks through to the material it came from.
SAM reflects what your product can actually serve rather than the whole category.
The realistic share is tied to channel capacity and competitive density, not to a flat percentage.
The estimate arrives with the wording and the evidence needed to present it.
The system works out the category, the players and the relevant geography.
Segments, their economics and channel coverage are derived from collected data.
TAM, SAM and SOM come out of that structure, with every input open to inspection.
Real product screens, not mockups.
The deck needs a market size that an investor cannot take apart in one question.
Leadership wants the number checked before the idea enters the plan.
A similar situation →You need the number in the deck verified, in the same format across every company.
A similar situation →| Segmentable | By hand | Agency | ChatGPT | |
|---|---|---|---|---|
| Method | Bottom-up from segments | One report multiplied by a guess | Mixed, described in an appendix | Plausible arithmetic, no basis |
| Time | ~2 hours | Days | 2-4 weeks | Minutes |
| Verifiability | Source behind every input | One citation, maybe | Partial | None |
| Survives a board question | Yes — open the input | Rarely | Usually | No |
Market size comes as part of the model: segments with economics, competitors and the evidence base behind the arithmetic.
from $79 · we set it up with you
TAM is the whole category, SAM is the part your product can actually serve given its shape and geography, and SOM is the share you can realistically take in the next few years given channels and competition.
From collected market material: industry sources, player data, pricing found in the market and demand signals. Each input opens into the source it came from.
Yes, and that is the point of showing the arithmetic. If you disagree with a price or a population input, you can see exactly what the disagreement does to the result.
That is the case it is built for. What makes an estimate credible is not the size of the number but whether the method and the inputs can be shown when asked.
A one-off Explore run starts at $79 and includes market sizing along with segments, competitors and channels. Dollar checkout is not open yet, so we set the first run up with you directly.
Then the estimate is built from the players themselves — their pricing, hiring, coverage and customer base — and the report says plainly which parts are modelled rather than measured.
Describe your product or just give us a link to your site — the system will collect the data and answer the question behind your task.